10+ Best Charts and Graphs Packages for Flutter in 2023
There’s no question that charts and graphs can be extremely helpful in visualizing data. And when it comes to developing apps with Flutter, there are a number of great packages available to help you create beautiful charts and graphs. In this blog post, we’ll take a look at five of the best chart and graph packages for Flutter. So whether you’re looking to create line graphs, bar charts, pie charts, or anything else, these packages will have you covered.
The Best Flutter Packages to Create Charts and Graphs
graphite
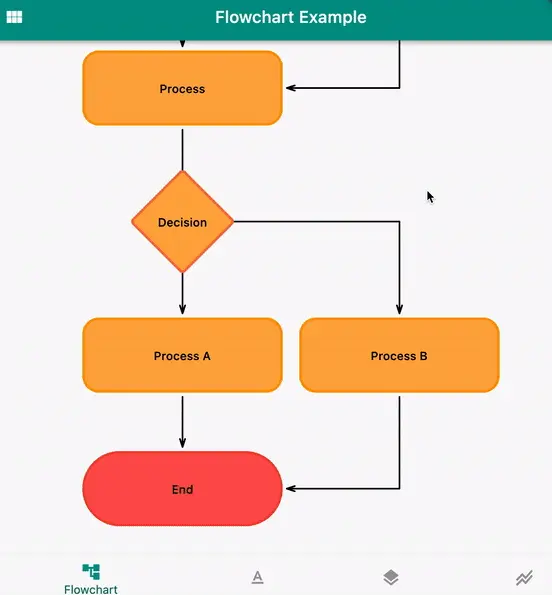
If you’re looking for an efficient tool to draw interactive direct graphs (flowcharts) of all shapes and sizes, then Graphite is the ideal package for you. With features such as node and edge gesture events, the ability to provide a graph-building direction that can be either horizontal or vertical, plus scaling & panning capabilities with an Interactive Widget, Graphite is a flexible option.
If that’s not enough, there’s also the ability to customize labels with either edge text or widget options so they look exactly how you want. Plus, completely customize edges using the paint builder feature and arrows with just a few clicks. And if desired you can add overlays as well, making Graphite a robust solution for any Flutter developer looking to create beautiful graphical representations in no time.
import 'package:flutter/material.dart';
import 'package:graphite/graphite.dart';

void main() => runApp(MyApp());
const list = '['
    '{"id":"A","next":[{"outcome":"B"}]},'
    '{"id":"B","next":[{"outcome":"C"},{"outcome":"D"},{"outcome":"E"}]},'
    '{"id":"C","next":[{"outcome":"F"}]},'
    '{"id":"D","next":[{"outcome":"J"}]},{"id":"E","next":[{"outcome":"J"}]},'
    '{"id":"J","next":[{"outcome":"I"}]},'
    '{"id":"I","next":[{"outcome":"H"}]},{"id":"F","next":[{"outcome":"K"}]},'
    '{"id":"K","next":[{"outcome":"L"}]},'
    '{"id":"H","next":[{"outcome":"L"}]},{"id":"L","next":[{"outcome":"P"}]},'
    '{"id":"P","next":[{"outcome":"M"},{"outcome":"N"}]},'
    '{"id":"M","next":[]},{"id":"N","next":[]}'
    ']';

class MyApp extends StatelessWidget {
  @override
  Widget build(BuildContext context) {
    return MaterialApp(
      title: 'Flutter Graphite',
      theme: ThemeData(
        primarySwatch: Colors.teal,
      ),
      home: MyHomePage(),
    );
  }
}

class MyHomePage extends StatefulWidget {
  MyHomePage({Key key}) : super(key: key);
  @override
  _MyHomePageState createState() => _MyHomePageState();
}

class _MyHomePageState extends State<MyHomePage> {
  @override
  Widget build(BuildContext context) {
    return Scaffold(
      body: DirectGraph(
        list: nodeInputFromJson(list),
        defaultCellSize: const Size(100.0, 100.0),
        cellPadding: const EdgeInsets.all(20),
        orientation: MatrixOrientation.Vertical,
      ),
    );
  }
}
graphic
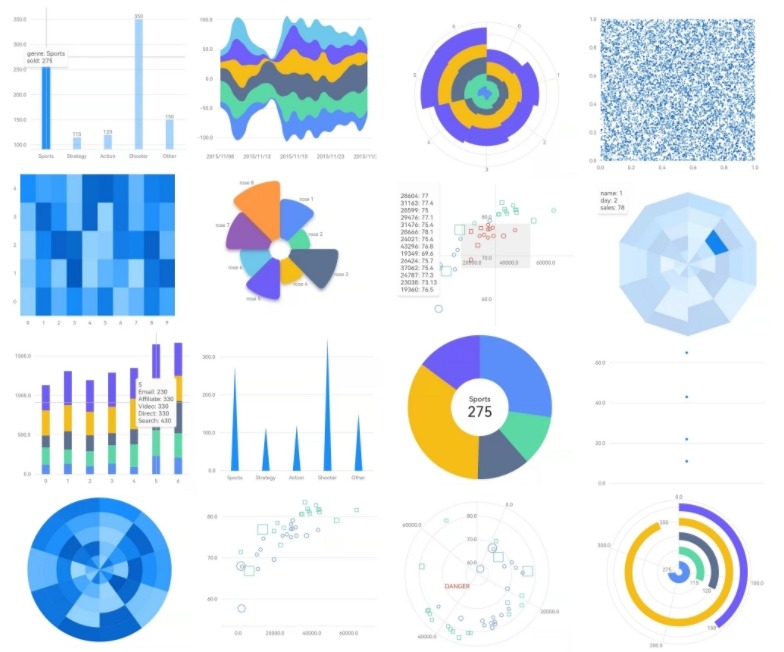
Data visualization can be hard. You need to know how to code, and even then it can be difficult to get your data looking the way you want it to.
With graphic, you can create beautiful visualizations in no time. The library provides an efficient grammar of data visualization that makes charting simple and fun. Plus, with easy-to-use customization options, you can create unique charts that fit your needs perfectly.
fl_chart
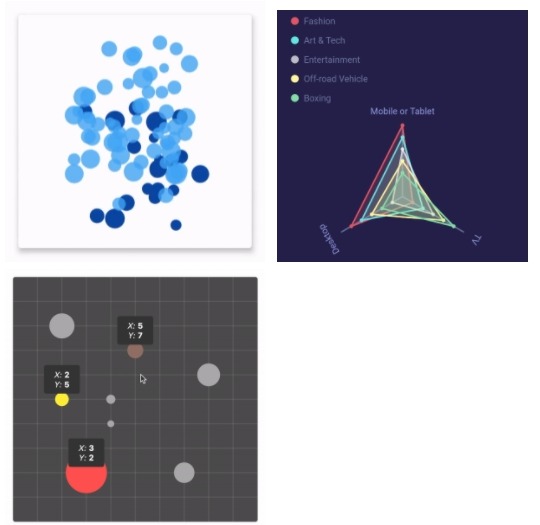
fl_chart is a chart library for Flutter that makes it easy to create and customize beautiful charts for your apps. With this library, you’ll be able to easily display data in Line Charts, Bar Charts, and Pie Charts.
fcharts
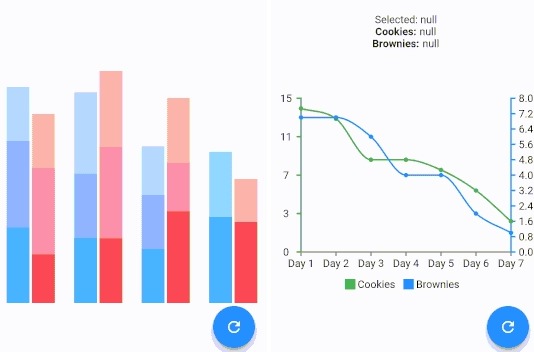
Producing charts and graphs can be difficult, especially if you’re not familiar with the underlying technology. The fcharts package makes it easy to produce beautiful, responsive charts in Flutter. With a simple API, you can quickly create stunning visualizations for your app or website.
mp_chart
MPFlutterChart is the library you need if you want to add charts and graphs to your app and you are familiar with the popular AndroidMP Chart library.
This easy-to-use chart library was built specifically for Flutter developers. With MPFlutterChart, you can quickly add charts and graphs to your app with just a few lines of code. It is a Flutter chart package with an intuitive user interface that may be used in your app.
chart_engine
Not only do developers need to be able to quickly create graphs and charts, they also need to be able to use different chart engines depending on their needs.
With chart_engine, you can easily create graphs with ChartJS or ApexCharts, two of the most popular chart engines available today. This library is lightweight and easy to use, so you can get your work done faster.
radar_chart
You need to make a radar chart, but you don’t want to use a library that’s not customizable and looks like everyone else’s. radar_chart is completely customizable, so you can make it look exactly how you want it to.
chart_components
chart_components is a library of Flutter chart components that makes it easy for developers to create animated bar charts and calendar grid charts. The components are customizable, so they can be tailored to fit the developer’s needs.
Developers need an easy way to create animated bar charts and calendar grid charts. These components should be customizable so that they fit the developer’s needs.
interactive_chart
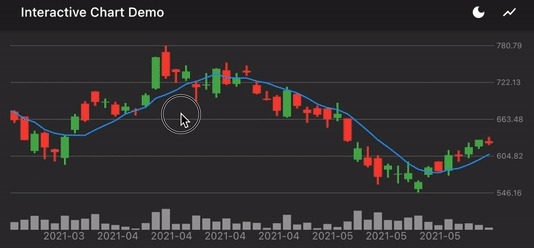
Traditional candlestick charts are difficult to use because you have to scroll up and down to see different price points. It’s hard to make accurate investment decisions if you can’t easily see the data.
interactive_chart is a new candlestick chart that makes it easy to zoom in and out and pan across the data. Now you can let your users make informed investment decisions quickly and easily.
time_chart
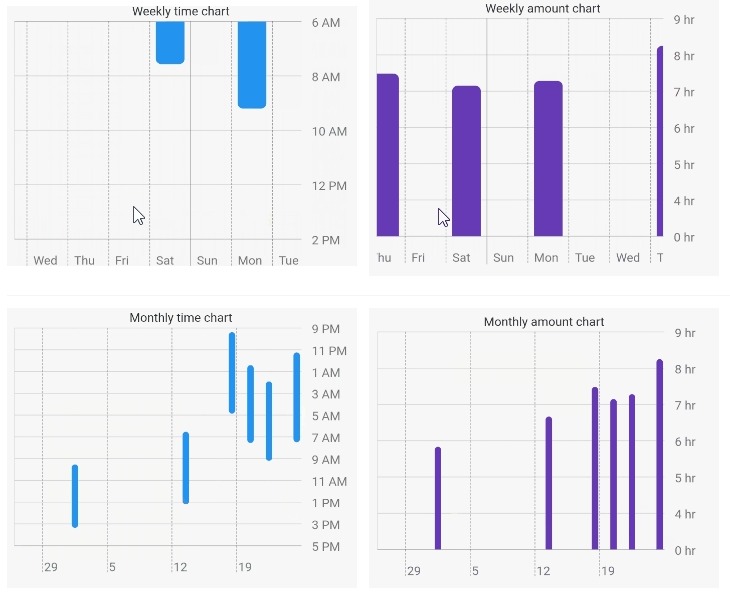
time_chart is easy to use and highly customizable, so you can create the perfect time chart for your app. Plus, it supports both English and Korean languages, so you can easily create charts in your preferred language.
flutter_charts
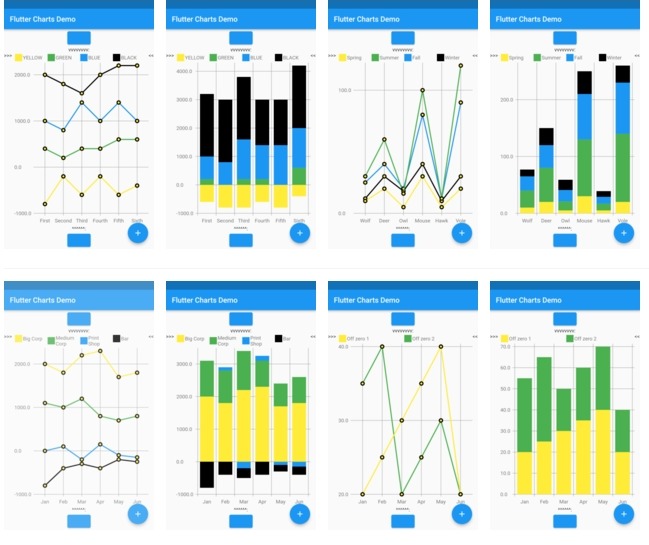
This library lets you create line charts and bar charts by specifying data as a simple array. It supports many types of charts.