5 Best Free JavaScript Timeline Plugins
If you’re looking to add a timeline to your website, there are plenty of great JavaScript plugins to choose from. In this post, we’ll take a look at five of the best free plugins, and we’ll also discuss some of the key features to look for in a timeline plugin.
Top Open-Source JavaScript Timeline Plugins
D3.js

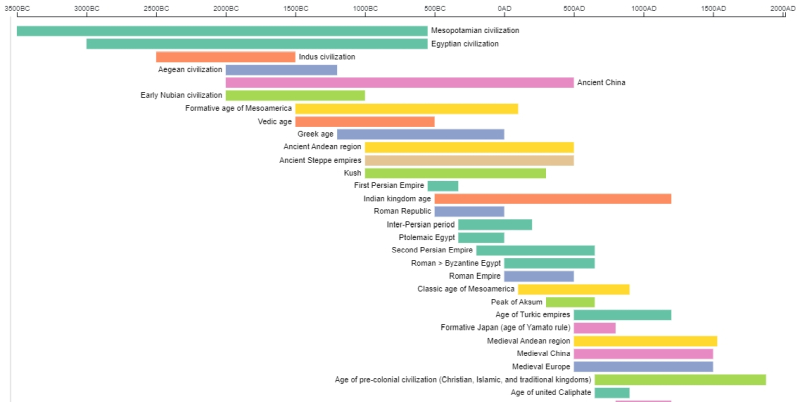
D3.js is a JavaScript library for modifying and styling documents depending on data. This plugin is free and open source, and it offers a wide range of features, including support for multiple types of data (e.g., CSV, JSON, XML), zoom and panning, and customizable tooltip content.
It is one of the most popular libraries used by developers and can be used to create a wide range of different types of timelines. The library allows developers to control the complexity of their timelines, making them more flexible and interactive. Additionally, D3.js can be used to create custom visualizations that can be used to communicate information more effectively.
TimelineJS3
TimelineJS 3 is a JavaScript library that enables anyone to create visually rich, interactive timelines. The software is easy to use, even for beginners with no technical skills. All you need is a Google spreadsheet.
With TimelineJS 3, you can tell dynamic stories that engage your audience. It is good for telling stories about history, news events, people’s lives, and more. The timeline can be customized to include images, videos, and other multimedia content.
TimelineJS can pull in media from a variety of image and video networks. Twitter, Flickr, YouTube, Vimeo, Vine, Dailymotion, Google Maps, Wikipedia, SoundCloud, Document Cloud, and more are just a few examples!
The software is also highly customizable, so you can create a unique experience for your users. Whether you’re a beginner or an expert, TimelineJS 3 is the perfect tool for creating engaging, informative timelines.
Vis Timeline library
The Vis Timeline library is a great tool for data visualization and I highly recommend it to anyone who needs to visualize data in a timeline or graph format. The library is easy to use and has a wide range of features that makes it perfect for data visualization.
The library is a time-based data visualization chart that may be used to represent data.
The data items can occur on the same date or have a beginning and end date (a range). Timeline dragging and scrolling allow you to shift and zoom in on the timeline at will. In the timeline, things may be added, modified, and removed.
The time scale on the axis is automatically updated, and it can display scales from milliseconds to years.
Squarechip Timeline library
The Squarechip Timeline library is a lightweight JavaScript library to create horizontal and vertical timelines that are responsive and easy to configure.
Whether you’re using the API or data attributes, the Timeline library is built with performance in mind, so you can be confident that your website will run fast and smoothly. Plus, with small file size, you won’t have to worry about taking up too much space on your server.
And because the Timeline library is agnostic, it will work with any other libraries you’re using on your site.
Timeline Storyteller
Timeline Storyteller is an expressive visual storytelling environment developed at Microsoft Research. You can use it to present different aspects of timeline data using a palette of timeline representations, scales, and layouts.
The controls for filtering, highlighting, and annotation allow you to explore your data in new and creative ways. Timeline Storyteller is also tightly integrated with Power BI, making it easy to share your timelines with others.
Whether you’re presenting data to a group of colleagues or displaying a personal timeline on your website, Timeline Storyteller makes it easy to tell your story.